2013年1月31日星期四
Android and slf4j : “java.lang.NoClassDefFoundError: org.slf4j.LoggerFactory”
Check if your jar files is inside of lib folder if it so create another folder as libs and put all you jar files.
Delete lib folder and again add all you jars in your project from libs in
Build Path-> Configure Build path ->Select Java Build path from Left Pane -> Add Jars
关于Android写LOG日志到SD卡文件之microlog4android使用
最近在搞andoird项目时,经常碰到客户那边机器型号不一样,导致程序有BUG问题,而我们这边又无法定位这个BUG的确切位置(因为没有LOG文件)。
因此找了一下把程序日志写在SD卡的相关资料,就像WEB的log4j一样,生成一个日志文件到SD卡。
找了半天,没有找到一个满意的开源软件,就找到了microlog4android,用起来虽然不大满意,不过也能满足大部分需求了。
具体使用如下:
1、下载
到http://code.google.com/p/microlog4android/downloads/list 下载microlog4android-1.0.0.jar和microlog.properties文件
2、建立使用logger对象
private static final Logger logger = LoggerFactory.getLogger(main.class);
3、在程序的第一个activity的oncreate方法里初始化方法
PropertyConfigurator.getConfigurator(this).configure();
4、把microlog.properties文件放到assets文件夹里
注意:assets文件夹是与res文件夹平级的
然后更改microlog.properties文件为以下内容:
microlog.level=DEBUG
microlog.appender=LogCatAppender;FileAppender
microlog.formatter=PatternFormatter
microlog.formatter.PatternFormatter.pattern=%c [%P] %m %T
microlog.appender=LogCatAppender;FileAppender
microlog.formatter=PatternFormatter
microlog.formatter.PatternFormatter.pattern=%c [%P] %m %T
5、写日志记录
logger.debug("这是debug信息");
6、在AndroidManifest.xml 添加写sd卡的权限
<uses-permission android:name="android.permission.WRITE_EXTERNAL_STORAGE" />
运行程序,然后到SD卡根目录,可以发现有一个microlog.txt的文件,里面就是我们的日志了。
后续:
有朋友问如何更改日志文件的路径和名称,在网上找了一通的资料,没找到答案,只好到https://github.com/johanlkarlsson/microlog4android 下载源代码,经过查看源代码的PropertyConfigurator类,发现源代码里有这么一个配置参数microlog.appender.FileAppender.File,这样应该就可以更改日志文件的路径和名称了。
配置文件如下:
microlog.level=DEBUG
microlog.appender=FileAppender;LogCatAppender
microlog.appender.FileAppender.File=mylog.txt
microlog.formatter=PatternFormatter
microlog.formatter.PatternFormatter.pattern=%c [%P] %m %T
microlog.appender=FileAppender;LogCatAppender
microlog.appender.FileAppender.File=mylog.txt
microlog.formatter=PatternFormatter
microlog.formatter.PatternFormatter.pattern=%c [%P] %m %T
运行程序,发现日志文件还是叫microlog.txt,更改名称无效,找了各种原因都无法解决,只好反编译我们之前下载的microlog4android-1.0.0.jar包,发现PropertyConfigurator这个类和刚刚从GIT下载的源代码PropertyConfigurator类不一样,microlog4android-1.0.0.jar包里的PropertyConfigurator类没有这样的一个参数microlog.appender.FileAppender.File,只好把从GIT下载下来的源代码,重新打个包,暂时打成microlog4android-1.1.jar,然后重新运行程序,OK,搞定,日志文件名称变成了我们配置的mylog.txt。
android httprequest java.net.UnknownHostException
Check the emulator log messages. There's a good chance you just aren't asking for the INTERNET permission in your app manifest
this is what i am using: ... <uses-permission android:name="android.permission.INTERNET"></uses-permission> </manifest>
AndroidGUI27:findViewById返回null的解决办法
在用Eclipse进行Android的界面开发,通过findViewById试图获取界面元素对象时,该方法有时候返回null,造成这种情况主要有以下两种情形。
第一种情形是最普通的。比如main.xml如下,其中有一个ListView,其id为lv_contactbook
<?xml version="1.0"encoding="utf-8"?>
<LinearLayout xmlns:android="http://schemas.android.com/apk/res/android"
android:orientation="vertical"
android:layout_width="fill_parent"
android:layout_height="fill_parent"
>
<EditText android:id="@+id/et_search"
android:layout_width="fill_parent"
android:layout_height="wrap_content"
android:text=""
/>
<ListView android:id="@+id/lv_contactbook"
android:layout_width="fill_parent"
android:layout_height="wrap_content"
/>
</LinearLayout>
如果在Activity对应的代码中,是这样的写的:
@Override
public void onCreate(BundlesavedInstanceState)
{
super.onCreate(savedInstanceState);
ListViewlv = (ListView)findViewById(R.id.lv_contactbook);
setContentView(R.layout.main);
//…
}
即在setContentView调用之前,调用了findViewById去找main布局中的界面元素lv_contactbook,那么所得到的lv一定是null。正确的做法是将上面代码中加粗的哪一行,挪至setContentView方法调用之后。
修改Linux SSH默认22端口
首先修改配置文件
vi /etc/ssh/sshd_config
找到#Port 22一段,这里是标识默认使用22端口,修改为如下:
Port 22
Port 50000
然后保存退出
执行/etc/init.d/sshd restart
这样SSH端口将同时工作与22和50000上。
现在编辑防火墙配置:vi /etc/sysconfig/iptables
启用50000端口。
执行/etc/init.d/iptables restart
现在请使用ssh工具连接50000端口,来测试是否成功。如果连接成功了,则再次编辑sshd_config的设置,将里边的Port22删除,即可。
之所以先设置成两个端口,测试成功后再关闭一个端口,是为了方式在修改conf的过程中,万一出现掉线、断网、误操作等未知情况时候,还能通过另外一个端口连接上去调试以免发生连接不上必须派人去机房,导致问题更加复杂麻烦。
Eclipse 自动提示功能配置
配置步骤:
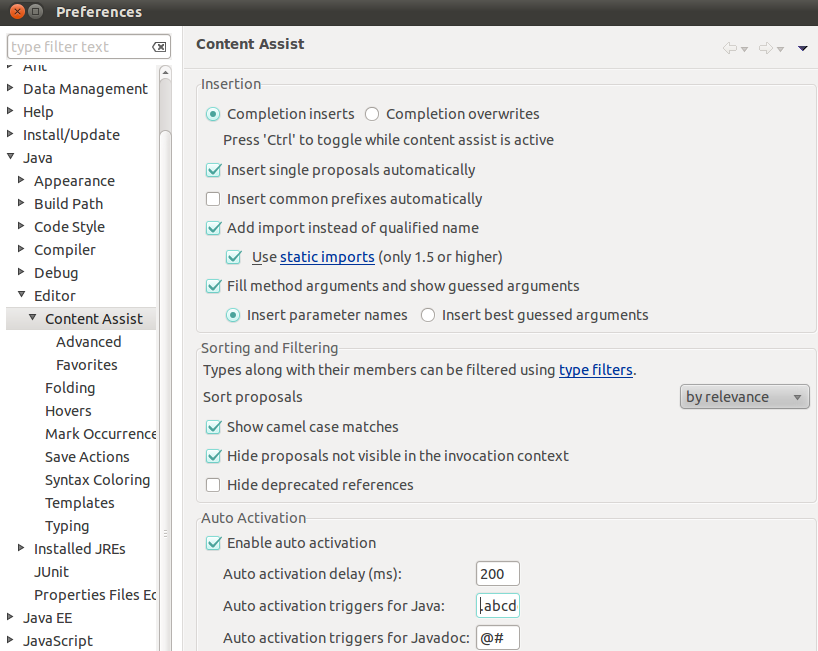
1 Window > Preferences > Java > Editor > Content Assist
2 “Auto Activation triggers for java”这个选项就是指触发代码提示的的选项,
把“.”修改成".abcdefghijklmnopqrstuvwxyzABCDEFGHIJKLMNOPQRSTUVWXYZ"
意思就是指遇到26个字母的大小写和.(这些符号就触发代码提示功能了)
配置截图:
Android开发学习笔记:Button事件实现方法的总结
下面介绍Button事件实现的两种方法
main.xml
<?xml version="1.0" encoding="utf-8"?>
<LinearLayout xmlns:android="http://schemas.android.com/apk/res/android"
android:orientation="vertical"
android:layout_width="fill_parent"
android:layout_height="fill_parent"
>
<TextView
android:layout_width="fill_parent"
android:layout_height="wrap_content"
android:text="@string/hello"
/>
<Button
android:id="@+id/myButton1"
android:text=" 按钮1 "
android:layout_width="wrap_content"
android:layout_height="wrap_content"
/>
<Button
android:id="@+id/myButton2"
android:text=" 按钮2 "
android:layout_width="wrap_content"
android:layout_height="wrap_content"
/>
</LinearLayout>
strings.xml
<?xml version="1.0" encoding="utf-8"?>
<resources>
<string name="hello">Hello World, ButtonDemoActivity!</string>
<string name="app_name">ButtonDemo</string>
</resources>
第一种:
ButtonDemoActivity.java
package com.android.ButtonDemo.activity;
import android.app.Activity;
import android.os.Bundle;
import android.view.View;
import android.view.View.OnClickListener;
import android.widget.Button;
import android.widget.Toast;
public class ButtonDemoActivity extends Activity {
Button myButton1,myButton2;
@Override
public void onCreate(Bundle savedInstanceState) {
super.onCreate(savedInstanceState);
setContentView(R.layout.main);
myButton1=(Button)findViewById(R.id.myButton1);
myButton2=(Button)findViewById(R.id.myButton2);
//使用匿名类注册Button事件
myButton1.setOnClickListener(new OnClickListener()
{
public void onClick(View v)
{
Toast.makeText(ButtonDemoActivity.this, "你点击了按钮1",Toast.LENGTH_LONG).show();
}
});
myButton2.setOnClickListener(new OnClickListener()
{
public void onClick(View v)
{
Toast.makeText(ButtonDemoActivity.this, "你点击了按钮2",Toast.LENGTH_LONG).show();
}
});
}
}
第二种:
ButtonDemoActivity.java
package com.android.ButtonDemo.activity;
import android.app.Activity;
import android.os.Bundle;
import android.view.View;
import android.view.View.OnClickListener;
import android.widget.Button;
import android.widget.Toast;
public class ButtonDemoActivity extends Activity {
Button myButton1,myButton2;
@Override
public void onCreate(Bundle savedInstanceState) {
super.onCreate(savedInstanceState);
setContentView(R.layout.main);
myButton1=(Button)findViewById(R.id.myButton1);
myButton2=(Button)findViewById(R.id.myButton2);
myButton1.setOnClickListener(new ButtonClick());
myButton2.setOnClickListener(new ButtonClick());
}
//创建一个类,来响应OnClickListener
class ButtonClick implements OnClickListener
{
public void onClick(View v)
{
switch (v.getId()) {
case R.id.myButton1:
Toast.makeText(ButtonDemoActivity.this, "你点击了按钮1",Toast.LENGTH_LONG).show();
break;
case R.id.myButton2:
Toast.makeText(ButtonDemoActivity.this, "你点击了按钮2",Toast.LENGTH_LONG).show();
break;
default:
break;
}
}
}
}
android: 服务器通信(GET,POST)
Android应用经常会和服务器端交互,这就需要手机客户端发送网络请求,下面介绍四种常用网络请求方式,
java.net包中的HttpURLConnection类
Get方式:
// Get方式请求
public static void requestByGet() throws Exception {
String path = "https://reg.163.com/logins.jsp?id=helloworld&pwd=android";
// 新建一个URL对象
URL url = new URL(path);
// 打开一个HttpURLConnection连接
HttpURLConnection urlConn = (HttpURLConnection) url.openConnection();
// 设置连接超时时间
urlConn.setConnectTimeout(5 * 1000);
// 开始连接
urlConn.connect();
// 判断请求是否成功
if (urlConn.getResponseCode() == HTTP_200) {
// 获取返回的数据
byte[] data = readStream(urlConn.getInputStream());
Log.i(TAG_GET, "Get方式请求成功,返回数据如下:");
Log.i(TAG_GET, new String(data, "UTF-8"));
} else {
Log.i(TAG_GET, "Get方式请求失败");
}
// 关闭连接
urlConn.disconnect();
}
Post方式:
// Post方式请求
public static void requestByPost() throws Throwable {
String path = "https://reg.163.com/logins.jsp";
// 请求的参数转换为byte数组
String params = "id=" + URLEncoder.encode("helloworld", "UTF-8")
+ "&pwd=" + URLEncoder.encode("android", "UTF-8");
byte[] postData = params.getBytes();
// 新建一个URL对象
URL url = new URL(path);
// 打开一个HttpURLConnection连接
HttpURLConnection urlConn = (HttpURLConnection) url.openConnection();
// 设置连接超时时间
urlConn.setConnectTimeout(5 * 1000);
// Post请求必须设置允许输出
urlConn.setDoOutput(true);
// Post请求不能使用缓存
urlConn.setUseCaches(false);
// 设置为Post请求
urlConn.setRequestMethod("POST");
urlConn.setInstanceFollowRedirects(true);
// 配置请求Content-Type
urlConn.setRequestProperty("Content-Type",
"application/x-www-form-urlencode");
// 开始连接
urlConn.connect();
// 发送请求参数
DataOutputStream dos = new DataOutputStream(urlConn.getOutputStream());
dos.write(postData);
dos.flush();
dos.close();
// 判断请求是否成功
if (urlConn.getResponseCode() == HTTP_200) {
// 获取返回的数据
byte[] data = readStream(urlConn.getInputStream());
Log.i(TAG_POST, "Post请求方式成功,返回数据如下:");
Log.i(TAG_POST, new String(data, "UTF-8"));
} else {
Log.i(TAG_POST, "Post方式请求失败");
}
}
org.apache.http包中的HttpGet和HttpPost类
Get方式:
// HttpGet方式请求
public static void requestByHttpGet() throws Exception {
String path = "https://reg.163.com/logins.jsp?id=helloworld&pwd=android";
// 新建HttpGet对象
HttpGet httpGet = new HttpGet(path);
// 获取HttpClient对象
HttpClient httpClient = new DefaultHttpClient();
// 获取HttpResponse实例
HttpResponse httpResp = httpClient.execute(httpGet);
// 判断是够请求成功
if (httpResp.getStatusLine().getStatusCode() == HTTP_200) {
// 获取返回的数据
String result = EntityUtils.toString(httpResp.getEntity(), "UTF-8");
Log.i(TAG_HTTPGET, "HttpGet方式请求成功,返回数据如下:");
Log.i(TAG_HTTPGET, result);
} else {
Log.i(TAG_HTTPGET, "HttpGet方式请求失败");
}
}
Post方式:
view plain
// HttpPost方式请求
public static void requestByHttpPost() throws Exception {
String path = "https://reg.163.com/logins.jsp";
// 新建HttpPost对象
HttpPost httpPost = new HttpPost(path);
// Post参数
List<NameValuePair> params = new ArrayList<NameValuePair>();
params.add(new BasicNameValuePair("id", "helloworld"));
params.add(new BasicNameValuePair("pwd", "android"));
// 设置字符集
HttpEntity entity = new UrlEncodedFormEntity(params, HTTP.UTF_8);
// 设置参数实体
httpPost.setEntity(entity);
// 获取HttpClient对象
HttpClient httpClient = new DefaultHttpClient();
// 获取HttpResponse实例
HttpResponse httpResp = httpClient.execute(httpPost);
// 判断是够请求成功
if (httpResp.getStatusLine().getStatusCode() == HTTP_200) {
// 获取返回的数据
String result = EntityUtils.toString(httpResp.getEntity(), "UTF-8");
Log.i(TAG_HTTPGET, "HttpPost方式请求成功,返回数据如下:");
Log.i(TAG_HTTPGET, result);
} else {
Log.i(TAG_HTTPGET, "HttpPost方式请求失败");
}
}
2013年1月30日星期三
MTR 进行网络诊断
MTR is a powerful network diagnostic tool that enables administrators to diagnose and isolate networking errors and provide helpful reports of network status to upstream providers. MTR represents an evolution of the traceroute command by providing a greater data sample, as if augmenting traceroute with ping output. This document provides an in depth overview of MTR, the data it generates, and how to properly interpret and draw conclusions based on the data provided by it.
For a basic overview of network diagnostic techniques consider our introduction to network diagnostics. If you suspect that you're having some other issue with your system, you may consider our overview of general system diagnostics. As a matter of course, it is assumed that all Linode deployments will have completed our getting started guide prior to beginning with this document.
Network Diagnostics Background
Networking diagnostic tools including ping, traceroute, and mtr use "ICMP" packets to test contention and traffic between two points on the Internet. When a user pings a host on the Internet, a series of ICMP packets are sent to the host, which responds by sending packets in return. The user's client is then able to compute the round trip time between two points on the Internet.
By contrast, tools such as traceroute and MTR send ICMP packets with incrementally increasing TTLs in order to view the route or series of hops that the packet makes between the origin and its destination. The TTL, or time to live, controls how many "hops" a packet will make before "dying" and returning to the host. By sending a series of packets and causing them to die and return after one hop, then two, then three, the client machine is able to assemble the route that traffic takes between hosts on the Internet.
Rather than provide a simple outline of the route that traffic takes across the Internet, MTR collects additional information regarding the state, connection, and responsiveness of the intermediate hosts. Because of this additional information, it is recommended that you use MTR whenever possible to provide the most complete overview of the connection between two hosts on the Internet. The following sections outline how to install the MTR software and how to interpret the results provided by this tool.
Installing MTR
On Debian and Ubuntu systems, issue the following commands to ensure that your system's package repository is up to date, that all installed packages are up to date, and finally to install MTR itself:
apt-get update
apt-get upgrade
apt-get install mtr-tiny
On CentOS and Fedora systems you will want to issue the following commands to update repositories, upgrade installed packages, and install the MTR program:
yum update
yum install mtr
On Arch Linux systems issue the following commands to update the package database and install MTR:
pacman -Sy
pacman -S mtr
You may also want to use MTR to diagnose networking issues from your local workstation. If you're running a Linux system, you can install MTR using the commands above. If you're running a Mac OS X workstation, you may install MTR from MacPorts by issuing the following command:
port install mtr
If your desktop runs Windows, you can use the windows port of MTR called "WinMTR". You can download this application from the WinMTR upstream.
Generating an MTR report
Because MTR provides an image of the route traffic takes from one host to another, you can think of it as a directional tool. Furthermore, the route taken between two points on the Internet can vary a great deal based on location and the routers that are located upstream of you. For this reason it is often recommended that you collect MTR reports in both directions for all hosts that are experiencing connectivity issues, or as many hosts as possible.
Linode support will often request "mtr reports" both to and from your Linode if you are experiencing networking issues. This is because, from time to time, MTR reports will not point to errors from one direction when there is still packet loss from the opposite direction. Having both reports is helpful as it can aid in the identification of issues and will be needed if a problem must be reported.
For the sake of clarity, when referring to MTR reports this document refers to the host running mtr as the source host and the host targeted by the query as thedestination host.
Using MTR on Unix-based Systems
Once installed on Linux or a Mac OS X system, you may generate MTR reports using the following syntax:
mtr --report [destination_host]
For example, to test the route and connection quality of traffic to the destination host example.com, run the following command from the desired source host:
mtr --report example.com
When contacting Linode Support with an issue that may be networking related, the technician may request MTR reports both to and from your Linode. An MTR report to your Linode would be run while logged in to your home PC (or other PC at your current location). The command may resemble the following:
mtr --report 87.65.43.21
Be sure to replace 87.65.43.21 with the IP address of your Linode, which is listed on the "Remote Access" tab of the Linode Manager. At the same time, also collect the MTR report from your Linode to your home network. This command may resemble the following:
mtr --report 12.34.56.78
Replace 12.34.56.78 with the IP address of your home network. If you are unsure of what your home IP address is you may use the first or second host on your outgoing MTR reports (depending on the configuration of your home network). Alternatively, you may use a third party service, such as WhatIsMyIP.com.
Using MTR on Windows Systems
Running MTR on Windows uses a GUI. Open WinMTR, type the destination host in the box as prompted, and select the start option to begin generating report data. You'll need to use the Linux version of MTR to generate the MTR report from your Linode. Please refer to the Linux section above for assistance.
Reading MTR Reports
Because MTR reports contain a wealth of information, they may be difficult to interpret at first. Consider the following example from a local connection to google.com:
$ mtr --report google.com
HOST: ducklington                  Loss%   Snt   Last   Avg  Best  Wrst StDev
  1. inner-cake                    0.0%    10    2.8   2.1   1.9   2.8   0.3
  2. outer-cake                    0.0%    10    3.2   2.6   2.4   3.2   0.3
  3. 68.85.118.13                  0.0%    10    9.8  12.2   8.7  18.2   3.0
  4. po-20-ar01.absecon.nj.panjde  0.0%    10   10.2  10.4   8.9  14.2   1.6
  5. be-30-crs01.audubon.nj.panjd  0.0%    10   10.8  12.2  10.1  16.6   1.7
  6. pos-0-12-0-0-ar01.plainfield  0.0%    10   13.4  14.6  12.6  21.6   2.6
  7. pos-0-6-0-0-cr01.newyork.ny.  0.0%    10   15.2  15.3  13.9  18.2   1.3
  8. pos-0-4-0-0-pe01.111eighthav  0.0%    10   16.5  16.2  14.5  19.3   1.3
  9. as15169-3.111eighthave.ny.ib  0.0%    10   16.0  17.1  14.2  27.7   3.9
 10. 72.14.238.232                 0.0%    10   19.1  22.0  13.9  43.3  11.1
 11. 209.85.241.148                0.0%    10   15.1  16.2  14.8  20.2   1.6
 12. lga15s02-in-f104.1e100.net    0.0%    10   15.6  16.9  15.2  20.6   1.7
The command issued to generate the report is "mtr --report google.com". This uses the report option which sends 10 packets to the host google.com and generates the output. Without the --report option, mtr will run continuously in an interactive environment. The interactive mode reflects current round trip times to each host. In most cases, the --report mode provides sufficient data in a useful format.
Following the command, MTR generates its output. Typically, MTR reports take a few seconds to generate. Do not be alarmed if it takes a few moments to complete the report. The report is comprised of a series of hops (12 in this case). "Hops" are the nodes, or routers, on the Internet that packets transverse to get to their destination. In the above example, packets travel through the "inner-cake" and "outer-cake" local network devices and then to "68.85.118.13"" followed by a series of named hosts. The names for the hosts are determined by reverse DNS lookups. If you want to omit the rDNS lookups you can use the --no-dns option, which would produce output similar to the following:
% mtr --no-dns --report google.com
HOST: deleuze                     Loss%   Snt   Last   Avg  Best  Wrst StDev
  1. 192.168.1.1                   0.0%    10    2.2   2.2   2.0   2.7   0.2
  2. 68.85.118.13                  0.0%    10    8.6  11.0   8.4  17.8   3.0
  3. 68.86.210.126                 0.0%    10    9.1  12.1   8.5  24.3   5.2
  4. 68.86.208.22                  0.0%    10   12.2  15.1  11.7  23.4   4.4
  5. 68.85.192.86                  0.0%    10   17.2  14.8  13.2  17.2   1.3
  6. 68.86.90.25                   0.0%    10   14.2  16.4  14.2  20.3   1.9
  7. 68.86.86.194                  0.0%    10   17.6  16.8  15.5  18.1   0.9
  8. 75.149.230.194                0.0%    10   15.0  20.1  15.0  33.8   5.6
  9. 72.14.238.232                 0.0%    10   15.6  18.7  14.1  32.8   5.9
 10. 209.85.241.148                0.0%    10   16.3  16.9  14.7  21.2   2.2
 11. 66.249.91.104                 0.0%    10   22.2  18.6  14.2  36.0   6.5
As a matter of best practice when discussing MTR reports, it is best to refer to any issue in terms of its hop number. Beyond simply seeing the path between servers that packets take to reach their host, MTR provides valuable statistics regarding the durability of that connection in the seven columns that follow. The Loss% column shows the percentage of packet loss at each hop. The Snt column counts the number of packets sent. The --report option will send 10 packets unless specified with "--report-cycles=[number-of-packets]", where [number-of-packets] represents the total number of packets that you want to send to the remote host.
The next four columns Last, Avg, Best, and Wrst are all measurements of latency in milliseconds (e.g. ms). Last is the latency of the last packet sent, Avg is average latency of all packets, while Best and Wrst display the best (shortest) and worst (longest) round trip time for a packet to this host. In most cases, the average (Avg) column should be the focus of your attention.
The final column, StDev, provides the standard deviation of the latencies to each host. The higher the standard deviation, the greater the difference is between measurements of latency. Standard deviation allows you to assess if the mean (average) provided represents the true center of the data set, or has been skewed by some sort of phenomena or measurement error. For example, if the standard deviation is high, the latency measurements were inconsistent. While some could have been low (i.e. 25ms), others may have been very high (i.e. 350ms). After averaging the latencies of the 10 packets sent, the average looks normal but may in fact not represent the data very well. If the standard deviation is high, take a look at the best and worst latency measurements to make sure the average is a good representation of the actual latency and not the result of too much fluctuation.
In most circumstances, you may think of the MTR output in three major sections. Depending on configurations, the first 2 or 3 hops often represent the source host's ISP, while the last 2 or 3 hops represent the destination host's ISP. The hops in between are the routers the packet traverses to reach its destination.
For example if MTR is run from your home PC to your Linode, the first 2 or 3 hops belong to your ISP. The last 3 hops belong to the datacenter where your Linode resides. Any hops in the middle are intermediate hops. When running MTR locally, if you see an abnormality in the first few hops near the source, contact your local service provider or investigate your local networking configuration. Conversely, if you see abnormalities near the destination you may want to contact the operator of the destination server or network support for that machine (e.g. Linode). Unfortunately, in cases where there are problems on the intermediate hops, both service providers will have limited ability to address those glitches.
Analyzing MTR Reports
Verifying Packet Loss
When analyzing MTR output, you are looking for two things: loss and latency. First, let's talk about loss. If you see a percentage of loss at any particular hop, that may be an indication that there is a problem with that particular router. However, it is common practice among some service providers to rate limit the ICMP traffic that MTR uses. This can give the illusion of packet loss when there is in fact no loss. To determine if the loss you're seeing is real or due to rate limiting, take a look at the subsequent hop. If that hop shows a loss of 0.0%, then you can be pretty sure that you're seeing ICMP rate limiting and not actual loss. See below for an example:
root@localhost:~# mtr --report www.google.com
HOST: ducklington               Loss%   Snt   Last   Avg  Best  Wrst StDev
1. 63.247.74.43                  0.0%    10    0.3   0.6   0.3   1.2   0.3
2. 63.247.64.157                50.0%    10    0.4   1.0   0.4   6.1   1.8
3. 209.51.130.213                0.0%    10    0.8   2.7   0.8  19.0   5.7
4. aix.pr1.atl.google.com        0.0%    10    6.7   6.8   6.7   6.9   0.1
5. 72.14.233.56                  0.0%    10    7.2   8.3   7.1  16.4   2.9
6. 209.85.254.247                0.0%    10   39.1  39.4  39.1  39.7   0.2
7. 64.233.174.46                 0.0%    10   39.6  40.4  39.4  46.9   2.3
8. gw-in-f147.1e100.net          0.0%    10   39.6  40.5  39.5  46.7   2.2
In this case, the loss reported between hops 1 and 2 is likely due to rate limiting on the second hop. Although traffic to the remaining eight hops all touch the second hop, there is no packet loss. If the loss continues for more than one hop, than it is possible that there is some packet loss or routing issues. Remember that rate limiting and loss can happen concurrently. In this case, take the lowest percentage of loss in a sequence as the actual loss. For instance, consider the following output:
root@localhost:~# mtr --report www.google.com
HOST: localhost                   Loss%   Snt   Last   Avg  Best  Wrst StDev
1. 63.247.74.43                   0.0%    10    0.3   0.6   0.3   1.2   0.3
2. 63.247.64.157                  0.0%    10    0.4   1.0   0.4   6.1   1.8
3. 209.51.130.213                60.0%    10    0.8   2.7   0.8  19.0   5.7
4. aix.pr1.atl.google.com        60.0%    10    6.7   6.8   6.7   6.9   0.1
5. 72.14.233.56                  50.0%   10    7.2   8.3   7.1  16.4   2.9
6. 209.85.254.247                40.0%   10   39.1  39.4  39.1  39.7   0.2
7. 64.233.174.46                 40.0%   10   39.6  40.4  39.4  46.9   2.3
8. gw-in-f147.1e100.net          40.0%   10   39.6  40.5  39.5  46.7   2.2
In this case, you see 60% loss between hops 2 and 3 as well as between hops 3 and 4. You can assume that the third and fourth hop is likely losing some amount of traffic because no subsequent host reports zero loss. However, some of the loss is due to rate limiting as several of the final hops are only experiencing 40% loss. When different amounts of loss are reported, always trust the reports from later hops.
Some loss can also be explained by problems in the return route. Packets will reach their destination without error, but have a hard time making the return trip. This will be apparent in the report, but may be difficult to deduce from the output of MTR. For this reason it is often best to collect MTR reports in both directions when you're experiencing an issue.
Additionally, resist the temptation to investigate or report all incidences of packet loss in your connections. The Internet protocols are designed to be resilient to some network degradation, and the routes that data takes across the Internet can fluctuate in response to load, brief maintenance events, and other routing issues. If your MTR report shows small amounts of loss in the neighborhood of 10%, there is no cause for real concern as the application layer will compensate for the loss which is likely transient.
Understanding Network Latency
In addition to helping you asses packet loss, MTR will also help you asses the latency of a connection between your host and the target host. By virtue of physical constraints, latency always increases with the number of hops in a route. However, the increases should be consistent and linear. Unfortunately, latency is often relative and very dependent on the quality of both host's connections and their physical distance. When evaluating MTR reports for potentially problematic connections, consider earlier fully functional reports as context in addition to known connection speeds between other hosts in a given area.
The connection quality may also affect the amount of latency you experience for a particular route. Predictably, dial-up connections will have much higher latency than cable modem connections to the same destination. Consider the following MTR report which shows a high latency:
root@localhost:~# mtr --report www.google.com
HOST: localhost                   Loss%   Snt   Last   Avg  Best  Wrst StDev
  1. 63.247.74.43                  0.0%    10    0.3   0.6   0.3   1.2   0.3
  2. 63.247.64.157                 0.0%    10    0.4   1.0   0.4   6.1   1.8
  3. 209.51.130.213                0.0%    10    0.8   2.7   0.8  19.0   5.7
  4. aix.pr1.atl.google.com        0.0%    10  388.0 360.4 342.1 396.7   0.2
  5. 72.14.233.56                  0.0%    10  390.6 360.4 342.1 396.7   0.2
  6. 209.85.254.247                0.0%    10  391.6 360.4 342.1 396.7   0.4
  7. 64.233.174.46                 0.0%    10  391.8 360.4 342.1 396.7   2.1
  8. gw-in-f147.1e100.net          0.0%    10  392.0 360.4 342.1 396.7   1.2
The amount of latency jumps significantly between hops 3 and 4 and remains high. This may point to a network latency issue as round trip times remain high after the fourth hop. From this report, it is impossible to determine the cause although a saturated peering session, a poorly configured router, or a congested link are frequent causes.
Unfortunately, high latency does not always mean a problem with the current route. A report like the one above means that despite some sort of issue with the 4th hop, traffic is still reaching the destination host and returning to the source host. Latency could be caused by a problem with the return route as well. The return route will not be seen in your MTR report, and packets can take completely different routes to and from a particular destination.
In the above example, while there is a large jump in latency between hosts 3 and 4 the latency does not increase unusually in any subsequent hops. From this it is logical to assume that there is some issue with the 4th router.
ICMP rate limiting can also create the appearance of latency, similar to the way that it can create the appearance of packet loss. Consider the following example:
root@localhost:~# mtr --report www.google.com
HOST: localhost                   Loss%   Snt   Last   Avg  Best  Wrst StDev
  1. 63.247.74.43                  0.0%    10    0.3   0.6   0.3   1.2   0.3
  2. 63.247.64.157                 0.0%    10    0.4   1.0   0.4   6.1   1.8
  3. 209.51.130.213                0.0%    10    0.8   2.7   0.8  19.0   5.7
  4. aix.pr1.atl.google.com        0.0%    10    6.7   6.8   6.7   6.9   0.1
  5. 72.14.233.56                  0.0%    10  254.2 250.3 230.1 263.4   2.9
  6. 209.85.254.247                0.0%    10   39.1  39.4  39.1  39.7   0.2
  7. 64.233.174.46                 0.0%    10   39.6  40.4  39.4  46.9   2.3
  8. gw-in-f147.1e100.net          0.0%    10   39.6  40.5  39.5  46.7   2.2
At first glance, the latency between hops 4 and 5 draws attention. However after the fifth hop, the latency drops drastically. The actual latency measured here is about 40ms. In cases like this, MTR draws attention to an issue which does not affect the service. Consider the latency to the final hop when evaluating an MTR report.
Common MTR Reports
Some networking issues are novel and require escalation to the operators of the upstream networks. However, there are a selection of common MTR reports that describe common networking issues. If you're experiencing some sort of networking issue and want to diagnose your problem, consider the following examples.
Destination Host Networking Improperly Configured
In the next example, it appears that there is 100% loss to a the destination host because of an incorrectly configured router. At first glance it appears that the packets are not reaching the host but this is not the case.
root@localhost:~# mtr --report www.google.com
HOST: localhost                   Loss%   Snt   Last   Avg  Best  Wrst StDev
  1. 63.247.74.43                  0.0%    10    0.3   0.6   0.3   1.2   0.3
  2. 63.247.64.157                 0.0%    10    0.4   1.0   0.4   6.1   1.8
  3. 209.51.130.213                0.0%    10    0.8   2.7   0.8  19.0   5.7
  4. aix.pr1.atl.google.com        0.0%    10    6.7   6.8   6.7   6.9   0.1
  5. 72.14.233.56                  0.0%    10    7.2   8.3   7.1  16.4   2.9
  6. 209.85.254.247                0.0%    10   39.1  39.4  39.1  39.7   0.2
  7. 64.233.174.46                 0.0%    10   39.6  40.4  39.4  46.9   2.3
  8. gw-in-f147.1e100.net         100.0    10    0.0   0.0   0.0   0.0   0.0
The traffic does reach the destination host however, the MTR report shows loss because the destination host is not sending a reply. This may be the result of improperly configured networking or firewall (iptables) rules that cause the host to drop ICMP packets.
The way you can tell that the loss is due to a misconfigured host is to look at the hop which shows 100% loss. From previous reports, you see that this is the final hop and that MTR does not try additional hops. While it is difficult to isolate this issue without a baseline measurement, these kinds of errors are quite common.
Residential or Business Router
Oftentimes residential gateways will cause MTR reports to look a little misleading.
% mtr --no-dns --report google.com
HOST: deleuze                     Loss%   Snt   Last   Avg  Best  Wrst StDev
  1. 192.168.1.1                   0.0%    10    2.2   2.2   2.0   2.7   0.2
  2. ???                          100.0    10    8.6  11.0   8.4  17.8   3.0
  3. 68.86.210.126                 0.0%    10    9.1  12.1   8.5  24.3   5.2
  4. 68.86.208.22                  0.0%    10   12.2  15.1  11.7  23.4   4.4
  5. 68.85.192.86                  0.0%    10   17.2  14.8  13.2  17.2   1.3
  6. 68.86.90.25                   0.0%    10   14.2  16.4  14.2  20.3   1.9
  7. 68.86.86.194                  0.0%    10   17.6  16.8  15.5  18.1   0.9
  8. 75.149.230.194                0.0%    10   15.0  20.1  15.0  33.8   5.6
  9. 72.14.238.232                 0.0%    10   15.6  18.7  14.1  32.8   5.9
 10. 209.85.241.148                0.0%    10   16.3  16.9  14.7  21.2   2.2
 11. 66.249.91.104                 0.0%    10   22.2  18.6  14.2  36.0   6.5
Do not be alarmed by the 100% loss reported. This does not indicate that there is a problem. You can see that there is no loss on subsequent hops.
An ISP Router Is Not Configured Properly
Sometimes a router on the route your packet takes is incorrectly configured and your packets may never reach their destination. Consider the following example:
root@localhost:~# mtr --report www.google.com
HOST: localhost                   Loss%   Snt   Last   Avg  Best  Wrst StDev
  1. 63.247.74.43                  0.0%    10    0.3   0.6   0.3   1.2   0.3
  2. 63.247.64.157                 0.0%    10    0.4   1.0   0.4   6.1   1.8
  3. 209.51.130.213                0.0%    10    0.8   2.7   0.8  19.0   5.7
  4. aix.pr1.atl.google.com        0.0%    10    6.7   6.8   6.7   6.9   0.1
  5. ???                           0.0%    10    0.0   0.0   0.0   0.0   0.0
  6. ???                           0.0%    10    0.0   0.0   0.0   0.0   0.0
  7. ???                           0.0%    10    0.0   0.0   0.0   0.0   0.0
  8. ???                           0.0%    10    0.0   0.0   0.0   0.0   0.0
  9. ???                           0.0%    10    0.0   0.0   0.0   0.0   0.0
 10. ???                           0.0%    10    0.0   0.0   0.0   0.0   0.0
The question marks appear when there is no additional route information. The following report displays the same issue:
root@localhost:~# mtr --report www.google.com
HOST: localhost                   Loss%   Snt   Last   Avg  Best  Wrst StDev
   1. 63.247.74.43                 0.0%    10    0.3   0.6   0.3   1.2   0.3
   2. 63.247.64.157                0.0%    10    0.4   1.0   0.4   6.1   1.8
   3. 209.51.130.213               0.0%    10    0.8   2.7   0.8  19.0   5.7
   4. aix.pr1.atl.google.com       0.0%    10    6.7   6.8   6.7   6.9   0.1
   5. 172.16.29.45                 0.0%    10    0.0   0.0   0.0   0.0   0.0
   6. ???                          0.0%    10    0.0   0.0   0.0   0.0   0.0
   7. ???                          0.0%    10    0.0   0.0   0.0   0.0   0.0
   8. ???                          0.0%    10    0.0   0.0   0.0   0.0   0.0
   9. ???                          0.0%    10    0.0   0.0   0.0   0.0   0.0
  10. ???                          0.0%    10    0.0   0.0   0.0   0.0   0.0
Sometimes, a poorly configured router will send packets in a loop. You can see that in the following example:
root@localhost:~# mtr --report www.google.com
HOST: localhost                   Loss%   Snt   Last   Avg  Best  Wrst StDev
  1. 63.247.74.43                  0.0%    10    0.3   0.6   0.3   1.2   0.3
  2. 63.247.64.157                 0.0%    10    0.4   1.0   0.4   6.1   1.8
  3. 209.51.130.213                0.0%    10    0.8   2.7   0.8  19.0   5.7
  4. aix.pr1.atl.google.com        0.0%    10    6.7   6.8   6.7   6.9   0.1
  5. 12.34.56.79                   0.0%    10    0.0   0.0   0.0   0.0   0.0
  6. 12.34.56.78                   0.0%    10    0.0   0.0   0.0   0.0   0.0
  7. 12.34.56.79                   0.0%    10    0.0   0.0   0.0   0.0   0.0
  8. 12.34.56.78                   0.0%    10    0.0   0.0   0.0   0.0   0.0
  9. 12.34.56.79                   0.0%    10    0.0   0.0   0.0   0.0   0.0
 10. 12.34.56.78                   0.0%    10    0.0   0.0   0.0   0.0   0.0
 11. 12.34.56.79                   0.0%    10    0.0   0.0   0.0   0.0   0.0
 12. ???                           0.0%    10    0.0   0.0   0.0   0.0   0.0
 13. ???                           0.0%    10    0.0   0.0   0.0   0.0   0.0
 14. ???                           0.0%    10    0.0   0.0   0.0   0.0   0.0
All of these reports show that the router at hop 4 is not properly configured. When these situations happen, the only way to resolve the issue is to contact the network administrator's team of operators at the source host.
ICMP Rate Limiting
ICMP rate limiting can cause apparent packet loss as described below. When there is packet loss to one hop that doesn't persist to subsequent hops, the loss is caused by ICMP limiting. See the following example:
root@localhost:~# mtr --report www.google.com
 HOST: localhost                   Loss%   Snt   Last   Avg  Best  Wrst StDev
   1. 63.247.74.43                  0.0%    10    0.3   0.6   0.3   1.2   0.3
   2. 63.247.64.157                 0.0%    10    0.4   1.0   0.4   6.1   1.8
   3. 209.51.130.213                0.0%    10    0.8   2.7   0.8  19.0   5.7
   4. aix.pr1.atl.google.com        0.0%    10    6.7   6.8   6.7   6.9   0.1
   5. 72.14.233.56                 60.0%    10   27.2  25.3  23.1  26.4   2.9
   6. 209.85.254.247                0.0%    10   39.1  39.4  39.1  39.7   0.2
   7. 64.233.174.46                 0.0%    10   39.6  40.4  39.4  46.9   2.3
   8. gw-in-f147.1e100.net          0.0%    10   39.6  40.5  39.5  46.7   2.2
In situations like this there is no cause for concern. Rate limiting is a common practice and it reduces congestion to prioritizes more important traffic.
Timeouts
Timeouts can happen for various reasons. Some routers will discard ICMP and no replies will be shown on the output as timeouts (???). Alternatively there may be a problem with the return route:
root@localhost:~# mtr --report www.google.com
HOST: localhost                   Loss%   Snt   Last   Avg  Best  Wrst StDev
  1. 63.247.74.43                  0.0%    10    0.3   0.6   0.3   1.2   0.3
  2. 63.247.64.157                 0.0%    10    0.4   1.0   0.4   6.1   1.8
  3. 209.51.130.213                0.0%    10    0.8   2.7   0.8  19.0   5.7
  4. aix.pr1.atl.google.com        0.0%    10    6.7   6.8   6.7   6.9   0.1
  5. ???                           0.0%    10    7.2   8.3   7.1  16.4   2.9
  6. ???                           0.0%    10   39.1  39.4  39.1  39.7   0.2
  7. 64.233.174.46                 0.0%    10   39.6  40.4  39.4  46.9   2.3
  8. gw-in-f147.1e100.net          0.0%    10   39.6  40.5  39.5  46.7   2.2
Timeouts are not necessarily an indication of packet loss. Packets still reach their destination without significant packet loss or latency. Timeouts may be attributable to routers dropping packets for QoS (quality of service) purposes or there may be some issue with return routes causing the timeouts. This is another false positive.
Resolving Routing and Networking Issues Identified in your MTR report
A majority of routing issues displayed by MTR reports are temporary. Most issues will clear up by themselves within 24 hours. In most cases, by the time you are able to notice a problem with a route, the Internet service provider's monitoring has already reported the problem and administrators are working to fix the issue. In cases where you are experiencing degraded service for an extended period of time, you may choose to alert a provider of the issues you're experiencing. When contacting a service provider, send MTR reports and any other relevant data you may have. Without usable data, providers have no way to verify or fix problems.
While routing errors and issues account for a percentage of network-related slowness, they are by no means the only cause of degraded performance. Network congestion, particularly over long distances during peak times, can become quite congested. Transatlantic and transpacific traffic can be quite variable and are subject to general network congestion. In these cases, it is recommended that you position hosts and resources as geographically close to their targeted audience as possible.
If you are experiencing connectivity issues and are unable to interpret your MTR report, you may open a support ticket including the output of your report in the "Support" tab of the Linode Manager and our technicians can help analyze your issue.
2013年1月29日星期二
Debian6 32位下最省资源挂vagex方法
其实我两个月前就重新挂vagex了……之前旧版非常省资源的,官方强制升级插件,旧版不能用了。
开了三个号,两个月的收益还不错o(╯□╰)o,够买独服了 (便宜vps需要自己挖掘)
vagex不允许多个账号用一个Paypal收款,这时候可以申请paypal企业账号,按几下鼠标即可
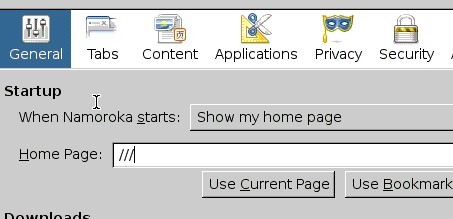
装firefox最新版的话,很多vps(尤其像burstnet这样的超瘦货)会卡死

(如图,其实已经卡死了,点哪里都没反应,ip也没上。512M openvz)
后来在用了这方法,发现128M的vps都能挂起……(虽然安装过程非常慢)
一键包下载(若用此一键包,执行完后请跳到第六步手工操作):
1、更新源以及安装相关依赖
2.下载firefox 3.6.28源码包,并编译安装(编译过程非常缓存,建议screen里执行)
3.下载flash和vagex插件并安装
4.启动vnc并设置
将下面两行加到最后
(startjwm后面的是 &号,被自动转换了)
5.设置VNC开机启动
添加权限使配置生效
6.添加计划任务
7.重启
8.用vncviewer连接你的vps,端口号为1。连接后如果看到firefox打开,离成功就不远了!
按下面步骤设置firefox:

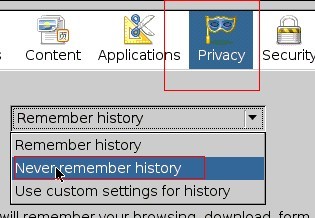
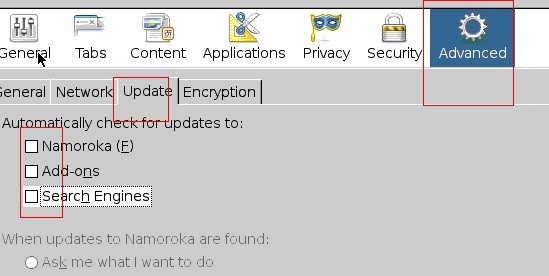
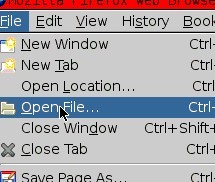
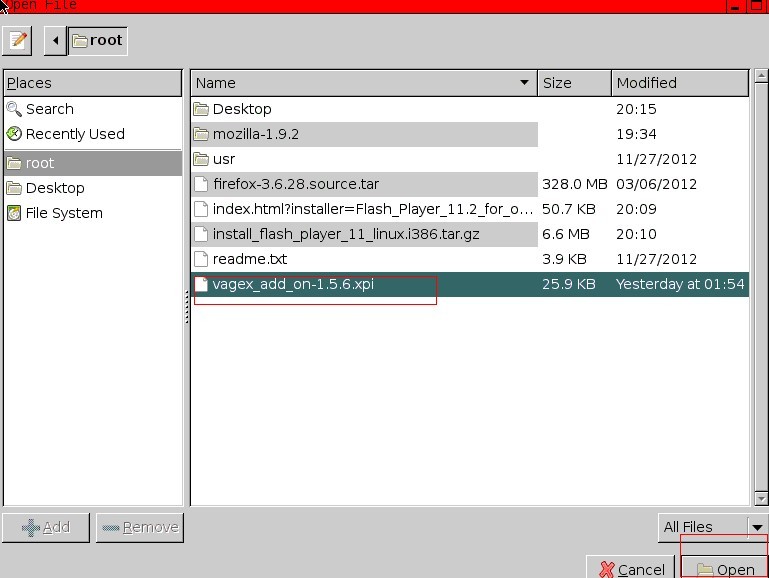
安装完插件重启,输入vagex id,然后就可以看到vagex正常工作了……
此时关闭firefox(切记),在终端输入firefox启动,然后reboot一次
再连接,如果正常,那么安装就结束了
内存占用情况(128M的vks)
(参考@想去吧)
订阅:
博文 (Atom)